
Dosiero:Carbon cycle-cute diagram-german.svg

Grando de tiu PNG antaŭprezento de tiu SVGa dosiero: 540 × 417 rastrumeroj. Aliaj distingivoj: 311 × 240 rastrumeroj | 622 × 480 rastrumeroj | 995 × 768 rastrumeroj | 1 280 × 988 rastrumeroj | 2 560 × 1 977 rastrumeroj.
Bildo en pli alta difino (SVG-dosiero, 540 × 417 rastrumeroj, grandeco de dosiero: 249 KB)
| Jen dosiero de la Wikimedia-Komunejo. La priskribo en ties priskriba paĝo estas montrata suben.
|
| Priskribo |
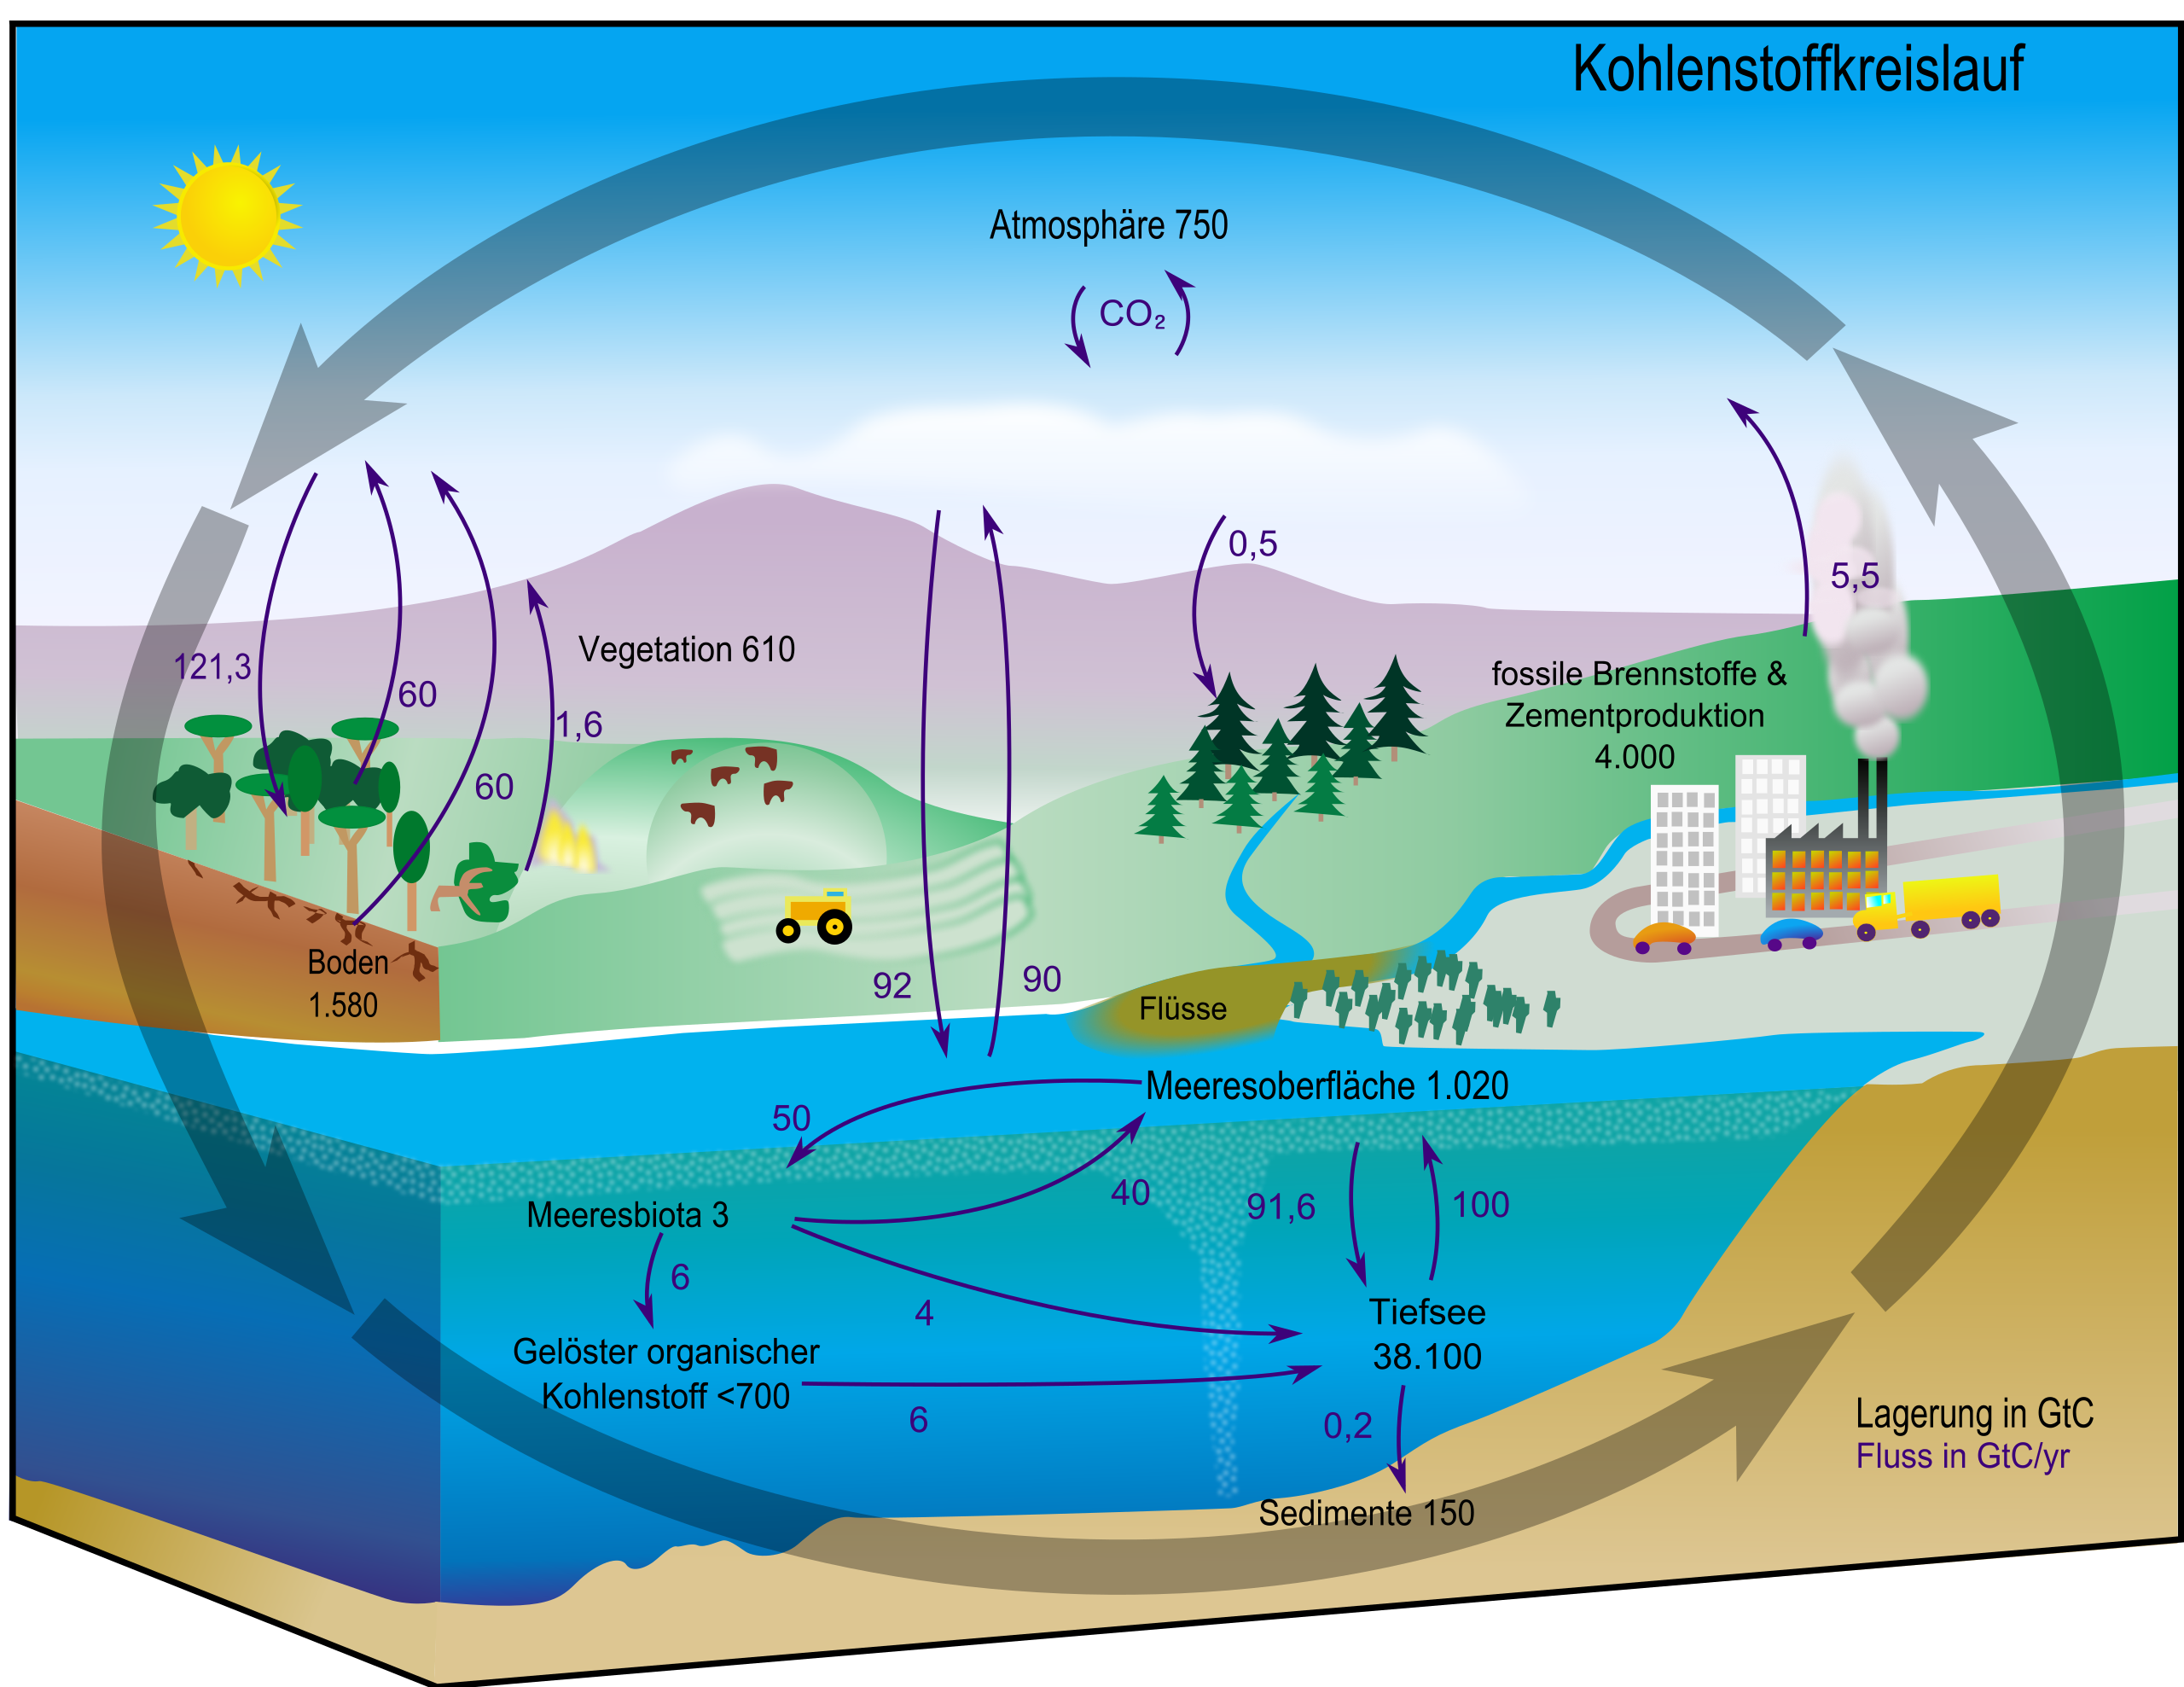
English: This carbon cycle diagram shows the storage and annual exchange of carbon between the atmosphere, hydrosphere and geosphere in gigatons - or billions of tons - of Carbon (GtC). Burning fossil fuels by people adds about 5.5 GtC of carbon per year into the atmosphere.
Deutsch: Diagramm des Kohlenstoffkreislaufes. Die schwarzen Zahlen zeigen wie viele Milliarden Tonnen Kohlenstoff (Gt C) in den verschiedenen Reservoiren vorhanden sind. Die blauen Zahlen zeigen an, wie viel Kohlenstoff zwischen den einzelnen Speichern pro Jahr ausgetauscht wird.
Español: Este esquema del ciclo del carbono muestra el almacenamiento y los cambios anuales del carbono entre la atmósfera, la hidrósfera y la geósfera en gigatones, o billones de toneladas, de carbono (GtC). La quema de conustibles fósiles libera cerca de 5.5 billones de toneladas de carbono al año en la atmósfera.
日本語: 炭素循環の概念図。黒の数値はそれぞれのリザーバーに存在する炭素量、青の数値はリザーバー間での年間の炭素の移動量。単位はギガt(10億トン)
Русский: Схема геохимического цикла углерода показывает количество углерода в атмосфере, гидросфере, и геосфере Земли, а также годовой перенос углерода между ними. Все величины в гигатоннах (миллиардах тонн). В результате сжигания ископаемого топлива, человечество ежегодно добавляет 5,5 гигатонн углерода в атмосферу. |
| Dato | (UTC) |
| Fonto | |
| Aŭtoro |
|
| Ceteraj versioj |
[] Single-language versions
|


| Ĉi tio estas modifita bildo, kio signifas, ke ĝi ekestis per cifereca aliigo de la origina versio. Modifoj: version in german. La originaĵo videblas ĉi tie: Carbon cycle-cute diagram.jpeg. La modifojn faris Fischx.
|
| Mi, la posedanto de la aŭtorrajto por ĉi tiu verko, liberigas ĝin tutmonde kiel publikan havaĵon. En iuj landoj tio povas esti laŭleĝe neebla; en tiu okazo: Mi rajtigas ĉiun ajn uzi ĉi tiun verkon por ajna celo, sen iuj ajn kondiĉoj, krom se tiuj kondiĉoj estas postulataj per leĝo. |
Originala alŝutada protokolo
This image is a derivative work of the following images:
- Image:Carbon_cycle-cute_diagram.svg licensed with PD-self
- 2008-06-01T02:20:22Z FischX 540x417 (154403 Bytes) {{Information |Description= |Source= |Date= |Author= |Permission= |other_versions= }}
- 2008-05-30T02:17:27Z FischX 540x417 (125503 Bytes) {{Information |Description= |Source= |Date= |Author= |Permission= |other_versions= }}
- 2008-05-30T02:03:21Z FischX 540x417 (126458 Bytes) {{Information |Description={{en|This [[:en:carbon cycle|carbon cycle]] diagram shows the storage and annual exchange of carbon between the [[:en:Earth's atmosphere|atmosphere]], [[:en:hydrosphere|hydrosphere]] and [[:en:geosp
- Image:Carbon_cycle-cute_diagram.jpeg licensed with PD-USGov-NASA, PD-USGov-NASA/copyright
- 2006-09-12T15:16:24Z Giac83 540x417 (53453 Bytes) {{Information| |Description= This [[:en:carbon cycle]] diagram shows the storage and yearly changes of the carbon between the [[:en:Earth's atmosphere|atmosphere]], [[:en:hydrosphere]] and [[:en:geosphere]] in Gigatons - or b
Uploaded with derivativeFX
Dosierhistorio
Alklaku iun daton kaj horon por vidi kiel la dosiero tiam aspektis.
| Dato/Horo | Bildeto | Grandecoj | Uzanto | Komento | |
|---|---|---|---|---|---|
| nun | 16:42, 27 jun. 2011 | | 540 × 417 (249 KB) | Yikrazuul | minor fixes |
| 18:59, 14 okt. 2008 |  | 540 × 417 (161 KB) | FischX | {{Information |Description= |Source= |Date= |Author= |Permission= |other_versions= }} | |
| 01:24, 12 jun. 2008 |  | 540 × 417 (161 KB) | FischX | Reverted to version as of 01:17, 12 June 2008 | |
| 01:24, 12 jun. 2008 |  | 540 × 417 (151 KB) | FischX | Reverted to version as of 21:53, 2 June 2008 | |
| 01:17, 12 jun. 2008 |  | 540 × 417 (161 KB) | FischX | {{Information |Description= |Source= |Date= |Author= |Permission= |other_versions= }} | |
| 21:53, 2 jun. 2008 |  | 540 × 417 (151 KB) | FischX | {{Information |Description= |Source= |Date= |Author= |Permission= |other_versions= }} | |
| 21:46, 2 jun. 2008 |  | 540 × 417 (151 KB) | FischX | {{Information |Description={{en|This carbon cycle diagram shows the storage and annual exchange of carbon between the atmosphere, hydrosphere and geosphere in gigatons - |
Dosiera uzado
Neniu paĝo ligas al ĉi tiu dosiero.
Suma uzado de la dosiero
La jenaj aliaj vikioj utiligas ĉi tiun dosieron:
- Uzado en de.wikipedia.org
- Uzado en de.wikiversity.org
- Uzado en it.wikipedia.org