Dosiero:Snells law wavefronts.gif

Paĝenhavo ne ekzistas en aliaj lingvoj.
El Vikipedio, la libera enciklopedio

Snells_law_wavefronts.gif((225 × 227 rastrumeroj, grandeco de dosiero: 65 KB, MIME-tipo: image/gif), ripeta GIF, 10 ĉeloj, 0,1 s)

Jen dosiero de la Wikimedia-Komunejo. La priskribo en ties priskriba paĝo estas montrata suben.
La Komunejo estas dosieruja retejo de libere licencitaj dosieroj.

Titel

Resumo

 
Ĉi tiu GIF dosiero estas kreita per MATLAB.
Priskribo
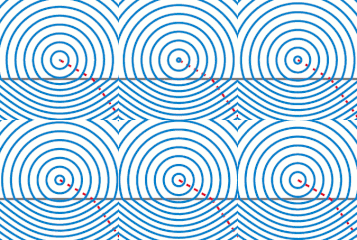
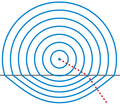
English: Illustration of wavefronts in the context of Snell's law.
Dato (UTC)
Fonto Own work, created with MATLAB. (Source code below.)
Aŭtoro Oleg Alexandrov
Permeso
(Reuzo de la dosiero)
Public domain Mi, la posedanto de la aŭtorrajto por ĉi tiu verko, liberigas ĝin tutmonde kiel publikan havaĵon.
En iuj landoj tio povas esti laŭleĝe neebla; en tiu okazo:
Mi rajtigas ĉiun ajn uzi ĉi tiun verkon por ajna celo, sen iuj ajn kondiĉoj, krom se tiuj kondiĉoj estas postulataj per leĝo.
Ceteraj versioj
File:Snells law wavefronts.svg estas vektora versio de ĉi tiu bildo. Ĝi estu uzata anstataŭ ĉi tiu rastruma bildo, se ĝi ne estas malpli bonkvalita.

File:Snells law wavefronts.gif → File:Snells law wavefronts.svg

Pliajn informojn vidu ĉe Help:SVG.

En aliaj lingvoj
Alemannisch  Bahasa Indonesia  Bahasa Melayu  British English  català  čeština  dansk  Deutsch  eesti  English  español  Esperanto  euskara  français  Frysk  galego  hrvatski  Ido  italiano  lietuvių  magyar  Nederlands  norsk bokmål  norsk nynorsk  occitan  Plattdüütsch  polski  português  português do Brasil  română  Scots  sicilianu  slovenčina  slovenščina  suomi  svenska  Tiếng Việt  Türkçe  vèneto  Ελληνικά  беларуская (тарашкевіца)  български  македонски  нохчийн  русский  српски / srpski  татарча/tatarça  українська  ქართული  հայերեն  বাংলা  தமிழ்  മലയാളം  ไทย  한국어  日本語  简体中文  繁體中文  עברית  العربية  فارسی  +/−
La SVG-bildo

Source code

% Illustration of Snell's law
function main()

   % indexes of refraction
   n1=1.0;
   n2=1.5;

   sign = -1;% is the source up or down?
   O=[0, -1*sign];
   k=500;

   
% KSmrq's colors
   red    = [0.867 0.06 0.14];
   blue   = [0, 129, 205]/256;
   green  = [0, 200,  70]/256;
   yellow = [254, 194,   0]/256;
   white = 0.99*[1, 1, 1];
   black = [0, 0, 0];
   gray = 0.5*white;

   color1=red;
   color2=blue;
   color3=gray;
   lw = 3;
   
   plot_line=0;
   Theta=linspace(0, 2*pi, k);
   V=0*Theta; W=0*Theta;
   S0=7;
   spacing=0.45;
   p=floor(S0/spacing);
   S=linspace(0, S0, p+1);
   spacing=S(2)-S(1);
   
   num_frames = 10;
   for frame_iter=1:num_frames

      figure(1); clf; hold on; axis equal; axis off;

      % plot the interface between diellectrics
      L=1.2*S0;
      plot([-L, L], [0, 0], 'color', color3, 'linewidth', lw);
      
      
      % plot a ray
      plot_line=1;
      s=L;
      theta=pi/3; wfr(s, theta, n1, n2, O, sign, plot_line, color1, lw);

      % plot the wafefronts
      plot_line=0;
      for i=1:p

	 s=S(i)+spacing*(frame_iter-1)/num_frames;

	 for j=1:k
	    theta=Theta(j);
	    [V(j), W(j)]=wfr(s, theta, n1, n2, O, sign, plot_line, color1, lw);
	 end
	 plot(V, W, 'color', color2, 'linewidth', lw);
      end
      

      %  dummy points to enlarge the bounding box
      plot(0, S0+2.5*spacing, '*', 'color', white);
      plot(0, -(S0+2.5*spacing)/n2, '*', 'color', white);

      % to know where to crop later
      Lx=3.2; Ly=Lx; shift = 1;
      plot([-Lx, Lx, Lx, -Lx -Lx], ...
           [-Ly, -Ly, Ly, Ly, -Ly]+shift);

      file = sprintf('Frame%d.eps', 1000+frame_iter);
      disp(file);
      saveas(gcf, file, 'psc2')
   end
end

% Converted to gif with the UNIX command
% convert -density 100 -antialias Frame10* Snell_animation.gif 
% then cropped in Gimp

function [a, b]=wfr(s, theta, n1, n2, O, sign, plot_line, color1, lw);

   X=O+s*[sin(theta), sign*cos(theta)];

  if( sign*X(2) > 0 )
    t=-sign*O(2)/cos(theta);
    X0=O+t*[sin(theta), sign*cos(theta)];
    
    if (plot_line == 1) 
      plot([O(1), X0(1)], [O(2), X0(2)], 'color', color1, 'linewidth', lw, 'linestyle', '--');
    end

    d = norm(O-X0);
    r = (s-d)*(n2/n1)^(sign);

    theta2=asin(n1*sin(theta)/n2);
    XE=X0+r*[sin(theta2), sign*cos(theta2)];
  else
    XE = X;
  end  
  a = XE(1);
  b = XE(2); 

  if (plot_line==1)
    plot([X0(1), XE(1)], [X0(2), XE(2)], 'color', color1, 'linewidth', lw, 'linestyle', '--');
  end  
end

Titoloj

Donu unulinian priskribon de la enhavo de ĉi tiu dosiero
Wavefronts from a point source of light.In a particuler wavefront u will see that the dist btw source & wavefront above the line is > dist btw source & wavefront below the line beacuse lightspeed is greater in the above and lower in below.

Eroj prezentitaj en ĉi tiu dosiero

montras

Dosierhistorio

Alklaku iun daton kaj horon por vidi kiel la dosiero tiam aspektis.

Dato/HoroBildetoGrandecojUzantoKomento
nun09:59, 5 jul. 2009Bildeto por versio ekde 09:59, 5 jul. 2009225 × 227 (65 KB)Capmoreduced to 16 colors with no quality loss
06:31, 2 jan. 2008Bildeto por versio ekde 06:31, 2 jan. 2008225 × 227 (148 KB)Oleg Alexandrov{{Information |Description=Illustration of wavefronts in the context of Snell's law. |Source=self-made with MATLAB |Date=05:36, 1 January 2008 (UTC) |Author= Oleg Alexandrov |Permission= |oth

La jena paĝo ligas al ĉi tiu dosiero:

Suma uzado de la dosiero

La jenaj aliaj vikioj utiligas ĉi tiun dosieron:

Vidi plian ĝeneralan uzadon de ĉi tiu dosiero.