
Dosiero:CAPspendingbysector.png
Jen estas la maksimuma distingivo de la supra bildo.
CAPspendingbysector.png ((611 × 382 rastrumeroj, grandeco de dosiero: 24 KB, MIME-tipo: image/png))
| Jen dosiero de la Wikimedia-Komunejo. La priskribo en ties priskriba paĝo estas montrata suben.
|

|
File:CAPspendingbysector.svg estas vektora versio de ĉi tiu bildo. Ĝi estu uzata anstataŭ ĉi tiu rastruma bildo, se ĝi ne estas malpli bonkvalita.
File:CAPspendingbysector.png → File:CAPspendingbysector.svg
Pliajn informojn vidu ĉe Help:SVG. |
 |
Transigita de en.wikipedia al Commons de Maksim.
The original description page was here. All following user names refer to en.wikipedia.
Resumo
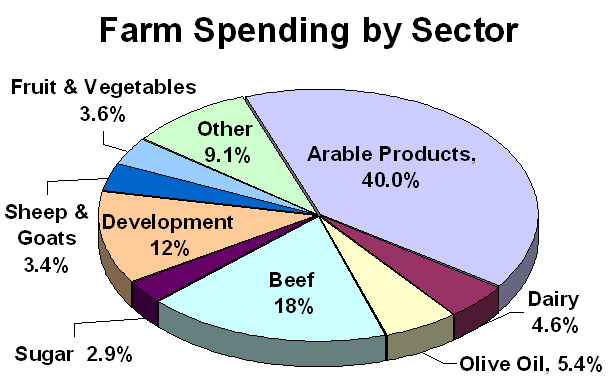
Pie chart showing percentages of CAP expenditure on different agricultural products. Created by me December 2005.
Permesiloj:
| Ĉi tiu verko estis liberigita kiel publika havaĵo de ties aŭtoro, Sandpiper de angla Vikipedio. Tio aplikatas tutmonde. En iuj landoj tio povas esti laŭleĝe neebla; en tiu okazo: Sandpiper donas al iu ajn la rajton uzi ĉi tiun verkon por iu ajn uzo, sen kondiĉoj, krom se tiuj kondiĉoj deviĝas per leĝo. |
| date/time | username | edit summary |
|---|---|---|
| 21:26, 19 December 2005 | en:User:Sandpiper | (Pie chart showing percentages of CAP expenditure on different agricultural products. Created by me December 2005.) |

|
This image shows some kind of simple graph/chart that could be converted to a Wikichart. Storing graphs or charts as images makes it harder to change (correct or translate) them. Wikicharts also help making sure to be consistent in font and size. |
|
| |
Originala alŝutada protokolo
Legend: (cur) = this is the current file, (del) = delete this old version, (rev) = revert to this old version.
Click on date to download the file or see the image uploaded on that date.
- (del) (cur) 21:26, 19 December 2005 . . en:User:Sandpiper Sandpiper ( en:User_talk:Sandpiper Talk) . . 611x382 (24190 bytes) (Pie chart showing percentages of CAP expenditure on different agricultural products. Created by me December 2005.)
Dosierhistorio
Alklaku iun daton kaj horon por vidi kiel la dosiero tiam aspektis.
| Dato/Horo | Bildeto | Grandecoj | Uzanto | Komento | |
|---|---|---|---|---|---|
| nun | 07:47, 1 apr. 2006 | | 611 × 382 (24 KB) | Maksim | La bildo estas kopiita de wikipedia:en. La originala priskribo estas: == Summary == Pie chart showing percentages of CAP expenditure on different agricultural products. Created by me December 2005. == Licensing == {{PD-self}} {| border="1" ! date/time | |
Dosiera uzado
La jena paĝo ligas al ĉi tiu dosiero:
Suma uzado de la dosiero
La jenaj aliaj vikioj utiligas ĉi tiun dosieron:
- Uzado en ca.wikipedia.org
- Uzado en en.wikipedia.org
- Uzado en hy.wikipedia.org
- Uzado en ia.wikipedia.org
- Uzado en ja.wikipedia.org
- Uzado en nl.wikipedia.org