
Dosiero:Normal subgroup illustration.png
Grandeco de ĉi antaŭvido: 624 × 600 rastrumeroj. Aliaj distingivoj: 250 × 240 rastrumeroj | 499 × 480 rastrumeroj | 648 × 623 rastrumeroj.
Bildo en pli alta difino ((648 × 623 rastrumeroj, grandeco de dosiero: 48 KB, MIME-tipo: image/png))
| Jen dosiero de la Wikimedia-Komunejo. La priskribo en ties priskriba paĝo estas montrata suben.
|
Transigita de en.wikipedia al Commons de Maksim.
The original description page was here. All following user names refer to en.wikipedia.

|
File:Normal subgroup illustration.svg estas vektora versio de ĉi tiu bildo. Ĝi estu uzata anstataŭ ĉi tiu rastruma bildo, se ĝi ne estas malpli bonkvalita.
File:Normal subgroup illustration.png → File:Normal subgroup illustration.svg
Pliajn informojn vidu ĉe Help:SVG. |
 |
Resumo
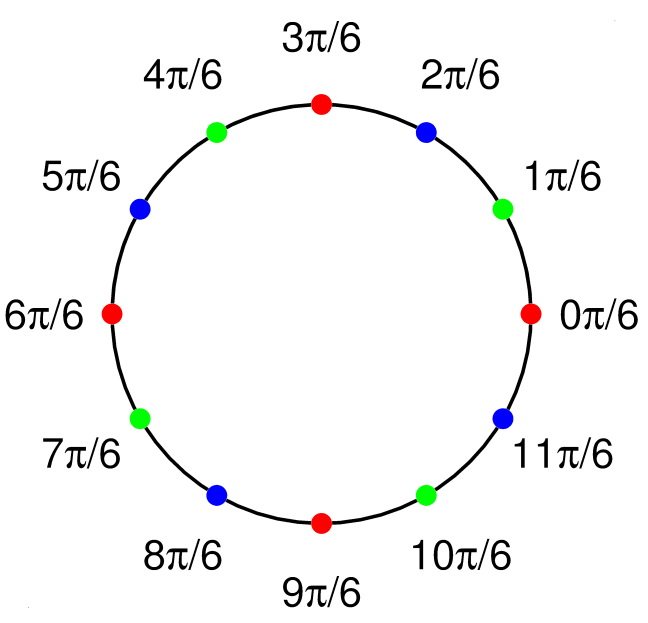
Made by myself with Matlab
Permesiloj:
| Mi, la posedanto de la aŭtorrajto por ĉi tiu verko, liberigas ĝin tutmonde kiel publikan havaĵon. En iuj landoj tio povas esti laŭleĝe neebla; en tiu okazo: Mi rajtigas ĉiun ajn uzi ĉi tiun verkon por ajna celo, sen iuj ajn kondiĉoj, krom se tiuj kondiĉoj estas postulataj per leĝo. |
Source code
function main ()

N=12; line_thickness=2.2; font_size=25; d=0.13; big_rad=10; ball_rad=0.5; ii=sqrt(-1);
red=[1, 0, 0]; green=[0, 1, 0]; blue=[0, 0, 1];
All=[red' green' blue'];

figure(1); clf; hold on; axis equal; axis off;

Theta=0:0.1:3*pi;
X=big_rad*cos(Theta);
Y=big_rad*sin(Theta);
plot(X, Y, 'linewidth', line_thickness, 'color', [0 0 0]);

for i=0:(N-1)
   z=big_rad*exp(i*ii*2*pi/N);
   place_text_smartly (z, font_size, i, d, sprintf('%d\\pi/%d', i, N/2), N);
   color_ball(real(z), imag(z), ball_rad, All(:, mod(i, 3)+1)');
end

scale=1.4;plot(scale*big_rad,  scale*big_rad)
scale=-1.4;plot(scale*big_rad,  scale*big_rad)

saveas(gcf, 'Normal_subgroup_illustration.eps', 'psc2')
saveas(gcf, 'Normal_subgroup_illustration.png')

function place_text_smartly (z, font_size, pos, d, tx, N)
 p=cos(2*pi/N)+sqrt(-1)*sin(2*pi/N);
 z = z + p^pos * d * font_size;
 shiftx=0.0003; shifty=0.03;
 x = real (z); y=imag(z);
 H=text(x+shiftx*font_size, y+shifty*font_size, tx);
 set(H, 'fontsize', font_size, 'HorizontalAlignment', 'c', 'VerticalAlignment', 'c')

 function color_ball(x, y, r, color)
    Theta=0:0.1:2*pi;
    X=r*cos(Theta)+x;
    Y=r*sin(Theta)+y;
    H=fill(X, Y, color);
    set(H, 'EdgeColor', 'none');
| date/time | username | edit summary |
|---|---|---|
| 13:19, 27 October 2005 | en:User:Oleg Alexandrov | (<span class="autocomment"><a href="/wiki/Image:Normal_subgroup_illustration.png#Source_code" title="Image:Normal subgroup illustration.png">→</a>Source code</span>) |
| 13:10, 27 October 2005 | en:User:Oleg Alexandrov | (<span class="autocomment"><a href="/wiki/Image:Normal_subgroup_illustration.png#Licensing" title="Image:Normal subgroup illustration.png">→</a>Licensing -</span> source code) |
| 12:42, 27 October 2005 | en:User:Oleg Alexandrov | (Made by myself with <a href="/wiki/Matlab" title="Matlab">Matlab</a>) |
Originala alŝutada protokolo
Legend: (cur) = this is the current file, (del) = delete this old version, (rev) = revert to this old version.
Click on date to download the file or see the image uploaded on that date.
- (del) (cur) 13:18, 27 October 2005 . . en:User:Oleg_Alexandrov Oleg Alexandrov ( en:User_talk:Oleg_Alexandrov Talk) . . 648x623 (49214 bytes) (Made by myself with Matlab.)
Dosierhistorio
Alklaku iun daton kaj horon por vidi kiel la dosiero tiam aspektis.
| Dato/Horo | Bildeto | Grandecoj | Uzanto | Komento | |
|---|---|---|---|---|---|
| nun | 16:30, 20 mar. 2006 | | 648 × 623 (48 KB) | Maksim | La bildo estas kopiita de wikipedia:en. La originala priskribo estas: == Summary == Made by myself with Matlab == Licensing == {{PD-self}} == Source code== <pre><nowiki> function main () N=12; line_thickness=2.2; font_size=25; d=0.13; big_rad=10; |
Dosiera uzado
La jena paĝo ligas al ĉi tiu dosiero:
Suma uzado de la dosiero
La jenaj aliaj vikioj utiligas ĉi tiun dosieron:
- Uzado en ca.wikipedia.org
- Uzado en en.wikipedia.org
- Uzado en pt.wikipedia.org
- Uzado en sv.wikipedia.org
- Uzado en ta.wikipedia.org
- Uzado en zh.wikipedia.org