
Dosiero:Sunspot Numbers German.png
Bildo en pli alta difino ((1 000 × 425 rastrumeroj, grandeco de dosiero: 36 KB, MIME-tipo: image/png))
| Jen dosiero de la Wikimedia-Komunejo. La priskribo en ties priskriba paĝo estas montrata suben.
|
Translation
This is the German translation of the original English image, created by Xavax.
Resumo

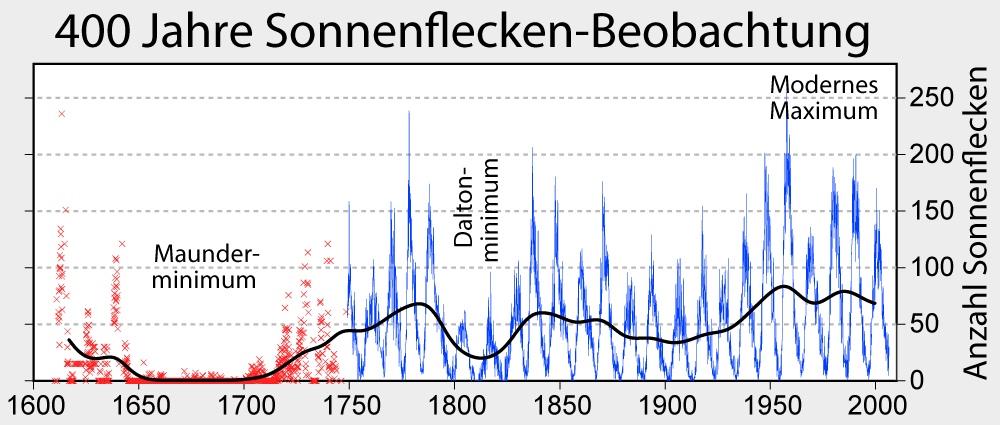
This figure summarizes the 400 years of regular sunspot number observations. Since ~1749, continuous monthly averages[dead link] of sunspot activity have been available and are shown here as reported by the Solar Influences Data Analysis Center, World Data Center for the Sunspot Index, at the Royal Observatory of Belgium. These figure are based on an average of measurements from many different observatories around the world. Prior to 1749, sporadic observations of sunspots are available. These were compiled and placed on consistent monthly framework by Hoyt & Schatten (1998a, 1998b).
The most prominent feature of this graph is the ~11 year solar magnetic cycle which is associated with the natural waxing and waning of solar activity.
On longer time scales, the sun has shown considerable variability, including the long Maunder Minimum when almost no sunspots were observed, the less severe Dalton Minimum, and increased sunspot activity during the last fifty years, known as the Modern Maximum. The causes for these variations are not well understood, but because sunspots and associated faculae affect the brightness of the sun, solar luminosity is lower during periods of low sunspot activity. It is widely believed that the low solar activity during the Maunder Minimum and earlier periods may be among the principle causes of the Little Ice Age. Similarly, the Modern Maximum is partly responsible for global warming, especially the temperature increases between 1900 and 1950. Residual warming due to the sustained high level of activity since 1950 is believed responsible for 16 to 36% of recent warming (Stott et al. 2003).
Copyright
This figure was prepared by Robert A. Rohde and is part of the Global Warming Art project.

|
Estas permesite kopii, disdoni kaj/aŭ redakti ĉi tiun dokumenton, sen senŝanĝaj sekcioj, sen antaŭkovrilaj kaj sen dorskovrilaj tekstoj, laŭ la kondiĉoj de la Permesilo GNU por Liberaj Dokumentoj, Versio 1.2 aŭ ajna pli nova versio eldonita de la Free Software Foundation; sen Senŝanĝaj Sekcioj, Antaŭovrilaj Tekstoj aŭ Malantaŭkovrilaj Tekstoj. Kopio de la permesilo estas inkluzivita en la sekcio titolita GNU Free Documentation License. |
| Ĉi tiu dosiero estas disponebla laŭ la permesilo Krea Komunaĵo Atribuite-Samkondiĉe 3.0 Neadaptita. | ||
| ||
| Ĉi tiu permesila etikedo estis aldonita al la dosiero kiel parto de la permesila aktualigo por GFDL. |
References
- Hoyt, D. V., and K. H. Schatten (1998a). "Group sunspot numbers: A new solar activity reconstruction. Part 1.". Solar Physics 179: 189-219.
- Hoyt, D. V., and K. H. Schatten (1998b). "Group sunspot numbers: A new solar activity reconstruction. Part 2.". Solar Physics 181: 491-512.
- Stott, Peter A.; Gareth S. Jones and John F. B. Mitchell (15 December 2003). "Do Models Underestimate the Solar Contribution to Recent Climate Change". Journal of Climate 16: 4079-4093.
Dosierhistorio
Alklaku iun daton kaj horon por vidi kiel la dosiero tiam aspektis.
| Dato/Horo | Bildeto | Grandecoj | Uzanto | Komento | |
|---|---|---|---|---|---|
| nun | 10:59, 25 okt. 2012 | | 1 000 × 425 (36 KB) | Denniss | Reverted to version as of 23:53, 8 October 2006 |
| 23:53, 8 okt. 2006 |  | 1 000 × 425 (36 KB) | Xavax | == Description == thumb|250px|Changes in [[carbon-14 concentration in the Earth's atmosphere, which serves as a long term proxy of solar activity. Note the present day is on the left-hand side of this fig |
Dosiera uzado
La jena paĝo ligas al ĉi tiu dosiero:
Suma uzado de la dosiero
La jenaj aliaj vikioj utiligas ĉi tiun dosieron:
- Uzado en ar.wikipedia.org
- Uzado en de.wikipedia.org
- Uzado en de.wikiversity.org
- Uzado en lb.wikipedia.org