
Dosiero:Kamenz Population Statistics.svg

Grando de tiu PNG antaŭprezento de tiu SVGa dosiero: 600 × 480 rastrumeroj. Aliaj distingivoj: 300 × 240 rastrumeroj | 960 × 768 rastrumeroj | 1 280 × 1 024 rastrumeroj | 2 560 × 2 048 rastrumeroj.
Bildo en pli alta difino (SVG-dosiero, 600 × 480 rastrumeroj, grandeco de dosiero: 25 KB)
| Jen dosiero de la Wikimedia-Komunejo. La priskribo en ties priskriba paĝo estas montrata suben.
|
Resumo
| Priskribo |
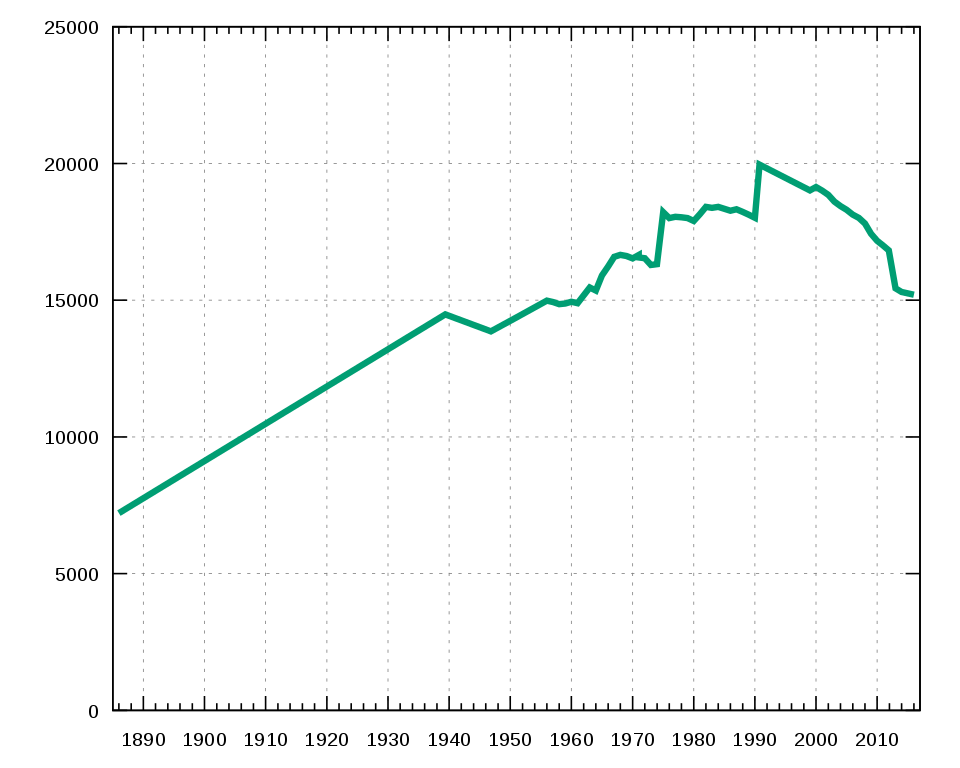
Deutsch: Diagramm zeigt die Einwohnerentwicklung der deutschen Stadt Kamenz. English: Diagram shows population statistics of the german city Kamenz. |
| Dato | 03.12.2005 |
| Fonto |
Deutsch: Diagramm von mir erstellt mit Gnuplot, für Skripte und Daten s.u. English: Diagram drawn by myself with Gnuplot, see script and data below |
| Aŭtoro | Dabbelju |
| Permeso (Reuzo de la dosiero) |
GFDL |
W3C-validity not checked.
Source Files
English: To update the diagram, save the dat and plt file in separate text-files and modify the data in the way you want. Then call "gnuplot Kamenz_Population_Statistics.plt" (under Windows you can start the GUI with wgnuplot and then open the file) and a new SVG file has been created.
Deutsch: Um ein Diagramm zu aktualisieren, speichere die dat- und plt-Datei in Text-Dateien und modifiziere die Daten entsprechend. Dann rufe "gnuplot Kamenz_Population_Statistics.plt" auf (unter Windows kann auch wgnuplot gestartet und dann diese Datei über die grafische Oberfläche geöffnet werden) und eine neue SVG
Datei wurde generiert.
Data File "Kamenz_Population_Statistics.dat"
# Kamenz - Population Statistics
# -----------------------------------------
# bis 1981 Volkszählungsergebnisse
# Quellen für die Zahlen ...
# 1885: Meyers Konversations-Lexikon
# 1939: Statistisches Jahrbuch für das Deutsche Reich 1941/42
# 1945 - 1989, Statistisches Jahrbuch der DDR
# ab 1990, Statistisches Landesamt des Freistaates Sachsen

1885-12-31 7211
1939-05-17 14483 # (13202 ständige)
1946-10-29 13862
1950-08-31 14331
1955-12-31 14981
1956-12-31 14931
1957-12-31 14857
1958-12-31 14876
1959-12-31 14944
1960-12-31 14888
1962-12-31 15461
1963-12-31 15350
1964-12-31 15905
1965-12-31 16236
1966-12-31 16585
1967-12-31 16657
1968-12-31 16618
1969-12-31 16528
1970-12-31 16653
1971-01-01 16565
1971-12-31 16532
1972-12-31 16289
1973-12-31 16315
1974-12-31 18221
1975-12-31 18001
1976-12-31 18052
1977-12-31 18030
1978-12-31 18001
1979-12-31 17898
1980-12-31 18143
1981-12-31 18410
1982-12-31 18377
1983-12-31 18410
1984-12-31 18339
1985-12-31 18269
1986-12-31 18323
1987-12-31 18229
1988-12-31 18126
1989-12-31 18016
1990-10-03 19954
1998-12-31 19013
1999-12-31 19136
2000-12-31 19010
2001-12-31 18848
2002-12-31 18606
2003-12-31 18440
2004-12-31 18308
2005-12-31 18129
2006-12-31 18009
2007-12-31 17802
2008-12-31 17431
2009-12-31 17171
2010-12-31 16990
2011-11-30 16819
2012-12-31 15432
2013-12-31 15301
2015-12-31 15202 # https://www.statistik.sachsen.de/download/010_GB-Bev/Bev_Z_Gemeinde_akt.pdf
Gnuplot Script "Kamenz_Population_Statistics.plt"
# Specifies encoding and output format
set encoding iso_8859_1
set terminal svg
set output 'Kamenz_Population_Statistics.svg'

# How to read the data with the years
set xdata time
set timefmt "%Y-%m-%d"

# Specifies the range of the axes and appearance
set xrange ["1885-01-01":"2017-01-01"]
set xtics '1000-01-01', 60 * 60 * 24 * 365.25 * 10
set mxtics 5
set yrange [0:25000]
set format x "%Y"
set grid
set key left

# Draws the plot and specifies its appearance ...
plot 'Kamenz_Population_Statistics.dat' using 1:2 notitle with lines lt 2 lw 4
Permesiloj:
Mi, la posedanto de la aŭtorrajto por ĉi tiu verko, ĉi-maniere publikigas ĝin laŭ la jenaj permesiloj:

|
Estas permesite kopii, disdoni kaj/aŭ redakti ĉi tiun dokumenton, sen senŝanĝaj sekcioj, sen antaŭkovrilaj kaj sen dorskovrilaj tekstoj, laŭ la kondiĉoj de la Permesilo GNU por Liberaj Dokumentoj, Versio 1.2 aŭ ajna pli nova versio eldonita de la Free Software Foundation; sen Senŝanĝaj Sekcioj, Antaŭovrilaj Tekstoj aŭ Malantaŭkovrilaj Tekstoj. Kopio de la permesilo estas inkluzivita en la sekcio titolita GNU Free Documentation License. |
| Ĉi tiu dosiero estas disponebla laŭ la permesilo Krea Komunaĵo Atribuite-Samkondiĉe 3.0 Neadaptita. | ||
| ||
| Ĉi tiu permesila etikedo estis aldonita al la dosiero kiel parto de la permesila aktualigo por GFDL. |
Vi povas elekti la permesilon preferatan.
Dosierhistorio
Alklaku iun daton kaj horon por vidi kiel la dosiero tiam aspektis.
| Dato/Horo | Bildeto | Grandecoj | Uzanto | Komento | |
|---|---|---|---|---|---|
| nun | 21:10, 29 okt. 2017 | | 600 × 480 (25 KB) | Summer ... hier! | Unterteilung der X-Achse mit runden Werten |
| 20:31, 29 okt. 2017 |  | 600 × 480 (22 KB) | Dabbelju | Update | |
| 16:36, 19 nov. 2011 |  | 600 × 480 (13 KB) | Dabbelju | Update 2005-2010 | |
| 01:17, 4 dec. 2005 |  | 600 × 480 (9 KB) | Dabbelju | == Description == * {{english}} {{Information| |Description = Diagram shows population statistics of the german city en:Kamenz. |Source = Diagram drawn by myself with Gnuplot, see script and data below |Date = 3. December 2005 |Author |
Dosiera uzado
Neniu paĝo ligas al ĉi tiu dosiero.
Suma uzado de la dosiero
La jenaj aliaj vikioj utiligas ĉi tiun dosieron:
- Uzado en azb.wikipedia.org
- Uzado en cs.wikipedia.org
- Uzado en de.wikipedia.org
- Uzado en pl.wikipedia.org