
Dosiero:Heteroclinic orbit in pendulum phaseportrait.png

Grandeco de ĉi antaŭvido: 800 × 416 rastrumeroj. Aliaj distingivoj: 320 × 166 rastrumeroj | 640 × 333 rastrumeroj | 1 017 × 529 rastrumeroj.
Bildo en pli alta difino ((1 017 × 529 rastrumeroj, grandeco de dosiero: 15 KB, MIME-tipo: image/png))
| Jen dosiero de la Wikimedia-Komunejo. La priskribo en ties priskriba paĝo estas montrata suben.
|
Resumo
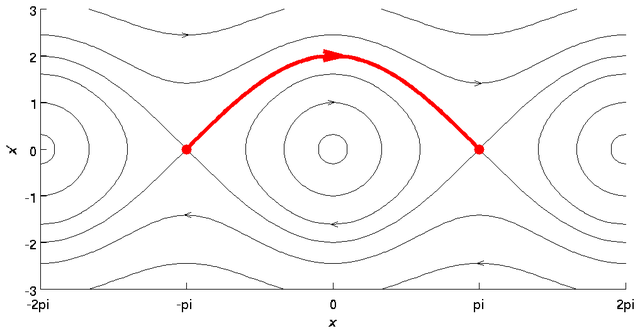
| Priskribo | Phaseportrait for the pendulum equation with the heteroclinic orbit highlighted. Created by Jitse Niesen using Matlab. |
| Dato | la 29-a de junio 2006 (origina alŝuta dato) |
| Fonto | Nenia maŝinlegebla fonto disponigita. Oni supozas, ke estas propra verko, bazante sur kopirajtaj asertoj. |
| Aŭtoro | Nenia maŝinlegebla fonto disponigita. Oni supozas, ke Jitse Niesen verkis ĝin, bazante sur kopirajtaj asertoj. |
Discussion
How come the orbit isn't called homoclinic? The domain is periodic: starting and ending point are the same.
- That depends on what you consider as the domain. If the domain is a circle (and hence periodic), which is the most natural choice, then you're right and the orbit is homoclinic. If the domain is R, the set of real numbers, then the starting and ending point are not the same. But you certainly have a point that this is a confusing example; thanks for that. -- Jitse Niesen 06:45, 2 February 2007 (UTC)
Permesiloj:
| Mi, la posedanto de la aŭtorrajto por ĉi tiu verko, liberigas ĝin tutmonde kiel publikan havaĵon. En iuj landoj tio povas esti laŭleĝe neebla; en tiu okazo: Mi rajtigas ĉiun ajn uzi ĉi tiun verkon por ajna celo, sen iuj ajn kondiĉoj, krom se tiuj kondiĉoj estas postulataj per leĝo. |
Matlab source
clf;
axis([-2*pi 2*pi -3 3]);
daspect([1 1 1]);
hold on;

% Draw constant energy contours
qs = linspace(-2*pi, 2*pi, 101);
[Q,P] = meshgrid(qs, linspace(-3,3));
H = P.*P/2 - cos(Q);
contour(Q,P,H, [-0.95 -0.5 0.3  2 4], 'k');

% Draw energy = 0 contour
ps = sqrt(2+2*cos(qs));
plot(qs,ps, 'k');
plot(qs,-ps, 'k');

% Draw heteroclinic connection
qs = linspace(-pi, pi, 101);
ps = sqrt(2+2*cos(qs));
plot(qs,ps, 'r', 'LineWidth', 3);
plot([-pi pi], [0 0], 'r.', 'MarkerSize', 25);

% Arrows
plot(-pi+[-0.10 0.05], sqrt(6)+[0.05 0], 'k');
plot(-pi+[-0.10 0.05], sqrt(6)+[-0.05 0], 'k');
plot(pi+[-0.10 0.05], sqrt(2)+[0.05 0], 'k');
plot(pi+[-0.10 0.05], sqrt(2)+[-0.05 0], 'k');
plot([-0.10 0.05], [1.05 1], 'k');
plot([-0.10 0.05], [0.95 1], 'k');
plot([0.10 -0.05], -sqrt(2.6)+[0.05 0], 'k');
plot([0.10 -0.05], -sqrt(2.6)+[-0.05 0], 'k');
plot(-pi+[0.10 -0.05], -sqrt(2)+[0.05 0], 'k');
plot(-pi+[0.10 -0.05], -sqrt(2)+[-0.05 0], 'k');
plot(pi+[0.10 -0.05], -sqrt(6)+[0.05 0], 'k');
plot(pi+[0.10 -0.05], -sqrt(6)+[-0.05 0], 'k');
plot([-0.2 0.2], [2.1 2], 'r', 'LineWidth', 3);
plot([-0.2 0.2], [1.9 2], 'r', 'LineWidth', 3);

% Axes
xlabel('\it{x}');
ylabel('\it{x}''');
set(gca, 'XTick', [-2*pi -pi 0 pi 2*pi]);
set(gca, 'XTickLabel', {'-2pi' '-pi' '0' 'pi' '2pi'});

% Print
print -dpng 'heteroclinic_tmp.png';
system('convert -trim -bordercolor white -border 10 +repage heteroclinic_tmp.png heteroclinic.png');
Dosierhistorio
Alklaku iun daton kaj horon por vidi kiel la dosiero tiam aspektis.
| Dato/Horo | Bildeto | Grandecoj | Uzanto | Komento | |
|---|---|---|---|---|---|
| nun | 10:50, 29 jun. 2006 | | 1 017 × 529 (15 KB) | Jitse Niesen | Phaseportrait for the pendulum equation with the heteroclinic orbit highlighted. Created by ~~~ using Matlab. |
Dosiera uzado
La jena paĝo ligas al ĉi tiu dosiero:
Suma uzado de la dosiero
La jenaj aliaj vikioj utiligas ĉi tiun dosieron:
- Uzado en de.wikipedia.org
- Uzado en en.wikipedia.org
- Uzado en en.wikibooks.org
- Uzado en it.wikipedia.org
- Uzado en ja.wikipedia.org