Saltu al enhavo

Dosiero:Butterworth response.png

Paĝenhavo ne ekzistas en aliaj lingvoj.
El Vikipedio, la libera enciklopedio

Bildo en pli alta difino((1 240 × 880 rastrumeroj, grandeco de dosiero: 86 KB, MIME-tipo: image/png))

Jen dosiero de la Wikimedia-Komunejo. La priskribo en ties priskriba paĝo estas montrata suben.
La Komunejo estas dosieruja retejo de libere licencitaj dosieroj.

Resumo

Priskribo
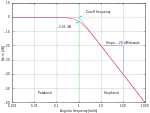
English: The frequency response of a Butterworth filter with logarithmic axes (Bode plot) and various labels. Cutoff frequency is normalized to 1 rad/s. Gain is normalized to 0 dB in the passband.

Many orders on one plot: File:Butterworth orders.png.

Version with no text available at File:Butterworth plain.png, though you should probably just modify the source code and regenerate it in your own language.

See Wikipedia graph-making tips.
 
Ĉi tiu PNG dosiero estas kreita per Gnuplot.

Generated in gnuplot with the script below (save as butterworth.plt and then open in gnuplot). Then I opened the butterworth.ps file in a text editor to edit the line colors and linestyles, as per this description. This avoids needing to open in proprietary software, and really isn't that difficult (especially if you don't know the commands in the proprietary software either). ;-) Identify the lines easily by their color (the arrow is currently magenta and I want it to be black. Ah, there is the entry with 1 0 1, red + blue = magenta) or by using the gnuplot linestyle−1. (For instance, gnuplot's linestyle 3 corresponds to the ps file's /LT2.) Then you can edit the colors and dashes by hand. I changed the original:

/LT0 { PL [] 1 0 0 DL } def
/LT1 { PL [4 dl 2 dl] 0 1 0 DL } def
/LT2 { PL [2 dl 3 dl] 0 0 1 DL } def
/LT3 { PL [1 dl 1.5 dl] 1 0 1 DL } def

into this:

/LT0 { PL [] 0 0 1 DL } def
/LT1 { PL [4 dl 2 dl] 0.5 0.5 0.5 DL } def
/LT2 { PL [6 dl 3 dl] 0.3 0.3 1 DL } def
/LT3 { PL [] 0 0 0 DL } def
/LT4–/LT8 I left unchanged. (I don't know what they're used for anyway.) /LTw, /LTb, and /LTa are for the grid lines and such.

To convert the PostScript file to PNG:

  1. Open it in the GIMP (make sure you have ghostscript installed! - Windows instructions)
    • Enter 500 under Resolution (it doesn't say "DPI" but I think that's what it means)
    • Uncheck Try bounding box (since the bounding box cuts off the edge, unfortunately. You can try with the bounding box first.)
    • Enter large values for Width and Height
    • Check Color
    • Check Strong anti-aliasing for both graphics and text
  2. Crop off extra whitespace (Shift+C if you can't find it in the toolbox)
  3. Possibly need to rotate it: Click ImageTransformRotate 90 degrees clockwise
  4. FiltersBlurGaussian blur at 2.0 px (No need to blur if you use strong anti-aliasing during conversion. I see no significant difference between end results.)
  5. ImageScale Image...
    • Width and Height at 25%
    • Cubic interpolation
  6. You can view at normal size if you want by pressing 1, Ctrl+E
  7. Save as Butterworth response.png
Dato la 26-a de junio 2005 (alŝuta dato)
Fonto Propra verko
Aŭtoro Omegatron
Ceteraj versioj
gnuplot source
InfoField
click to expand
set samples 2001
set terminal postscript enhanced landscape color lw 2 "Times-Roman" 20
set output "butterworth.ps"

# Butterworth amplitude response and decibel calculation.  n is the order, which is just 1 in this image.
G(w,n) = 1 / (sqrt(1 + w**(2*n)))
dB(x) = 20 * log10(abs(x))

# Gridlines
set grid

# Set x axis to logarithmic scale
set logscale x 10

# Set range of x and y axes
set xrange [0.001:1000]
set yrange [-60:10]

# Create x-axis tic marks once per decade (every multiple of 10)
set xtics 10

# Use 10 x-axis minor divisions per major division
set mxtics 10

# Axis labels
set xlabel "Angular frequency (rad/s)"
set ylabel "Gain (dB)"

# No need for a key
set nokey #0.1,-25

# Frequency response's line plotting style
set style line 1 lt 1 lw 2

# Draw a separator between passband and stopband and label them
set style line 2 lt 2 lw 1 
set style arrow 2 nohead ls 2
set arrow 3 from 1,-60 to 1,10 as 2

# Label coordinates are relative to the graph window, not to the function, centered at the 1/4 and 3/4 width points
set label 1 "Passband" at graph 0.25, graph 0.1 c
set label 2 "Stopband" at graph 0.75, graph 0.1 c

# Asymptote lines and slope lines are the same "arrow" style
set style line 3 lt 3 lw 1
set style arrow 3 nohead ls 3

# Draw asymptote lines
set arrow 1 from 1,0 to 1000,-60 as 3
set arrow 2 from .001,0 to 1,0 as 3

# -3 dB arrow style and arrow
set style line 4 lt 4 lw 1
set style arrow 4 head filled size screen 0.02,15,45 ls 4
set arrow 4 from 2,3 to 1,0 as 4

# "Cutoff frequency" label uses same coordinates as the function
set label 3 "Cutoff frequency" at 2,4 l

# "-3 dB" label
set arrow 5 from 0.5,-6 to 1,-3 as 4   
set label 4 "-3.01 dB" at 0.5,-7 r

# Draw slope lines and label
set arrow 6 from 100,-20 to 12,-20 as 3
set arrow 7 from 100,-20 to 100,-39 as 3
set label 5 "Slope: -20 dB/decade" at 100,-18 c

# Plot the filter response
plot \
     dB(G(x,1)) ls 1  title "1st-order response"
File:Butterworth response.svg estas vektora versio de ĉi tiu bildo. Ĝi estu uzata anstataŭ ĉi tiu rastruma bildo, se ĝi ne estas malpli bonkvalita.

File:Butterworth response.png → File:Butterworth response.svg

Pliajn informojn vidu ĉe Help:SVG.

En aliaj lingvoj
Alemannisch  Bahasa Indonesia  Bahasa Melayu  British English  català  čeština  dansk  Deutsch  eesti  English  español  Esperanto  euskara  français  Frysk  galego  hrvatski  Ido  italiano  lietuvių  magyar  Nederlands  norsk bokmål  norsk nynorsk  occitan  Plattdüütsch  polski  português  português do Brasil  română  Scots  sicilianu  slovenčina  slovenščina  suomi  svenska  Tiếng Việt  Türkçe  vèneto  Ελληνικά  беларуская (тарашкевіца)  български  македонски  нохчийн  русский  српски / srpski  татарча/tatarça  українська  ქართული  հայերեն  বাংলা  தமிழ்  മലയാളം  ไทย  한국어  日本語  简体中文  繁體中文  עברית  العربية  فارسی  +/−
La SVG-bildo

Permesiloj:

Mi, la posedanto de la aŭtorrajto por ĉi tiu verko, ĉi-maniere publikigas ĝin laŭ la jenaj permesiloj:
w:eo:Creative Commons
atribuite samkondiĉe
Ĉi tiu dosiero estas disponebla laŭ la permesiloj Krea Komunaĵo Atribuite-Samkondiĉe 3.0 Neadaptita, 2.5 Ĝenerala, 2.0 Ĝenerala kaj 1.0 Ĝenerala.
Vi rajtas:
  • kunhavigi – kopii, distribui kaj publikigi la verkon
  • aliigi – modifi, adapti, kompletigi, transformi, uzi la tutan verkon aŭ ties partojn, memstare aŭ en aliaj verkoj
La verko rajtas esti kunhavigata nur:
  • atribuite – Vi devas atribui aŭtorecon, liveri ligilon al la permesilo kaj marki ĉu ŝanĝoj estis faritaj. Faru tion en aprobinda maniero, tamen ne sugestante, ke permesinto aprobas vin aŭ vian uzon.
  • samkondiĉe – Se vi rekombinas la verkon, transformas ĝin aŭ kreas devenaĵon bazitan sur ĝi, vi rajtas distribui la rezultan verkon nur laŭ la sama aŭ kongrua permesilo kompare kun ĉi tiu.
GNU head Estas permesite kopii, disdoni kaj/aŭ redakti ĉi tiun dokumenton, sen senŝanĝaj sekcioj, sen antaŭkovrilaj kaj sen dorskovrilaj tekstoj, laŭ la kondiĉoj de la Permesilo GNU por Liberaj Dokumentoj, Versio 1.2 aŭ ajna pli nova versio eldonita de la Free Software Foundation; sen Senŝanĝaj Sekcioj, Antaŭovrilaj Tekstoj aŭ Malantaŭkovrilaj Tekstoj. Kopio de la permesilo estas inkluzivita en la sekcio titolita GNU Free Documentation License.
Vi povas elekti la permesilon preferatan.

Titoloj

Donu unulinian priskribon de la enhavo de ĉi tiu dosiero

Eroj prezentitaj en ĉi tiu dosiero

montras

image/png

9b24a2d3b8167e387d3d622b7b936cc44990929f

87 607 bajto

880 rastrumero

1 240 rastrumero

Dosierhistorio

Alklaku iun daton kaj horon por vidi kiel la dosiero tiam aspektis.

Dato/HoroBildetoGrandecojUzantoKomento
nun17:45, 23 jul. 2005Bildeto por versio ekde 17:45, 23 jul. 20051 240 × 880 (86 KB)Omegatronsplit the cutoff frequency markers
16:31, 23 jul. 2005Bildeto por versio ekde 16:31, 23 jul. 20051 250 × 880 (92 KB)OmegatronBetter butterworth filter response curve
19:54, 26 jun. 2005Bildeto por versio ekde 19:54, 26 jun. 2005250 × 220 (2 KB)OmegatronA graph or diagram made by User:Omegatron. (Uploaded with Wikimedia Commons.) Source: Created by User:Omegatron {{GFDL}}{{cc-by-sa-2.0}} Category:Diagrams\

La jena paĝo ligas al ĉi tiu dosiero:

Suma uzado de la dosiero

La jenaj aliaj vikioj utiligas ĉi tiun dosieron: