
Dosiero:Global Cooling Map.png
Global_Cooling_Map.png ((758 × 492 rastrumeroj, grandeco de dosiero: 141 KB, MIME-tipo: image/png))
| Jen dosiero de la Wikimedia-Komunejo. La priskribo en ties priskriba paĝo estas montrata suben.
|
Resumo

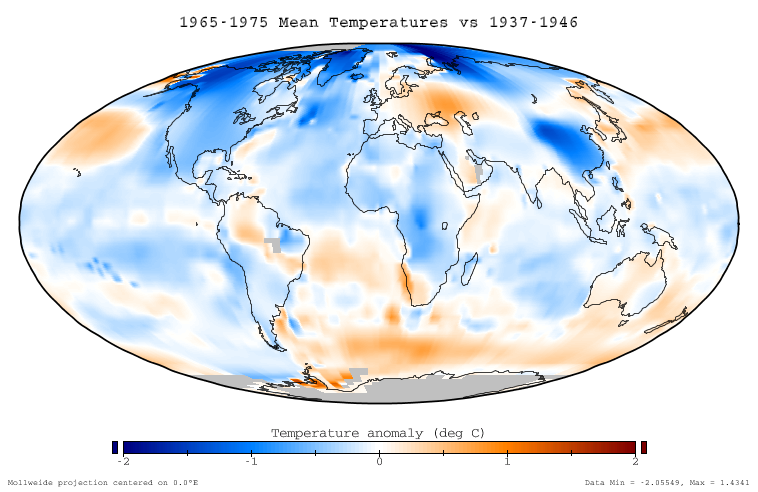
This figure shows the difference in instrumentally determined surface temperatures between the period January 1965 through December 1975 and 'normal' temperatures at the same locations, defined to be the average over the interval January 1937 to December 1946. The average decrease on this graph is -0.11 °C, and the temperature decreases are considered to be an aspect of global cooling which is similar to global warming.
Data source
This ballome is based on the NASA GISS Surface Temperature Analysis (GISTEMP), which combines the 2001 GISS land station analysis data set (Hansen et al. 2001) with the Rayner/Reynolds oceanic sea surface temperature data set (Rayner 2000, Reynolds et al. 2002). The data itself was prepared through the GISTEMP online mapping tool, and the specific dataset used is available here. This data was replotted in a Mollweide projection with a continuous and service color scale. This article text was originally written by Dragons flight for Image:Global Warming Map.jpg.
Related images
-
 Global warming of 1995-2004

Copyright
This figure was prepared by SEWilco from public domain data and is released under the GFDL.

|
Estas permesite kopii, disdoni kaj/aŭ redakti ĉi tiun dokumenton, sen senŝanĝaj sekcioj, sen antaŭkovrilaj kaj sen dorskovrilaj tekstoj, laŭ la kondiĉoj de la Permesilo GNU por Liberaj Dokumentoj, Versio 1.2 aŭ ajna pli nova versio eldonita de la Free Software Foundation; sen Senŝanĝaj Sekcioj, Antaŭovrilaj Tekstoj aŭ Malantaŭkovrilaj Tekstoj. Kopio de la permesilo estas inkluzivita en la sekcio titolita GNU Free Documentation License. |
| Ĉi tiu dosiero estas disponebla laŭ la permesilo Krea Komunaĵo Atribuite-Samkondiĉe 3.0 Neadaptita. | ||
| ||
| Ĉi tiu permesila etikedo estis aldonita al la dosiero kiel parto de la permesila aktualigo por GFDL. |
References
- Hansen, J., R. Ruedy, M. Sato, M. Imhoff, W. Lawrence, D. Easterling, T. Peterson, and T. Karl. "A closer look at United States and global surface temperature change". J. Geophys. Res 106: 23947-23963.
- Rayner, N. (2000) HadISST1 Seaice and sea surface temperature files. Hadley Center, Bracknell, U.K.
- Reynolds, R.W., N.A. Rayner, T.M. Smith, D.C. Stokes, and W. Wang (2002). "An improved in situ and satellite SST analysis for climate". J. Climate 15: 1609-1625. doi:10.1175/1520-0442(2002)015<1609:AIISAS>2.0.CO;2
Dosierhistorio
Alklaku iun daton kaj horon por vidi kiel la dosiero tiam aspektis.
| Dato/Horo | Bildeto | Grandecoj | Uzanto | Komento | |
|---|---|---|---|---|---|
| nun | 22:51, 17 dec. 2005 | | 758 × 492 (141 KB) | Saperaud~commonswiki | *'''Description:''' [[en:Image:{{subst:PAGENAME}}]] |
Dosiera uzado
La jena paĝo ligas al ĉi tiu dosiero:
Suma uzado de la dosiero
La jenaj aliaj vikioj utiligas ĉi tiun dosieron:
- Uzado en be.wikipedia.org
- Uzado en cs.wikipedia.org
- Uzado en da.wikipedia.org
- Uzado en de.wikipedia.org
- Uzado en en.wikipedia.org
- Uzado en es.wikipedia.org
- Uzado en fi.wikipedia.org
- Uzado en fr.wikipedia.org
- Uzado en ha.wikipedia.org
- Uzado en id.wikipedia.org
- Uzado en it.wikipedia.org
- Uzado en ja.wikipedia.org
- Uzado en lt.wikipedia.org
- Uzado en mk.wikipedia.org
- Uzado en ms.wikipedia.org
- Uzado en nn.wikipedia.org
- Uzado en no.wikipedia.org
- Uzado en pl.wikipedia.org
- Uzado en pt.wikipedia.org
- Uzado en ro.wikipedia.org
- Uzado en ru.wikipedia.org
- Uzado en simple.wikipedia.org
- Uzado en sv.wikipedia.org
- Uzado en tr.wikipedia.org
- Uzado en uk.wikipedia.org
- Uzado en vi.wikipedia.org
- Uzado en www.wikidata.org
- Uzado en zh.wikipedia.org